Baseball Science: Some Math, Analytics, and… Emotion
November 9, 2019
by Andrea Lloyd
The Astros and Nationals duked it out in the World Series, posing some interesting challenges to those interested in baseball science, the players, and the emotion behind this beloved sport.
Venezuelan five-foot five-inch Jose Altuve dashed beyond bases faster than a blink, scoring home runs and throwing balls across the field. Altuve debuted in the major league as an Astros player in 2011 and has been a valuable asset to the Astros ever since. Some find this surprising since he’s presumed to be the shortest active Major Baseball League player.
When the game began in the 1870s, the average player was 5 foot 9 inches. By the year 2000, the average player stood at 6 foot 1 inch. 5 foot 6 inches might not sound unusual (that’s the height Jose Altuve is officially listed as)–but makes the shortlist of shortest MLB players ever. The Astros initially turned him away because he was too short, way back in 2006. But that doesn’t matter, honestly, after a look at Altuve’s statistics.
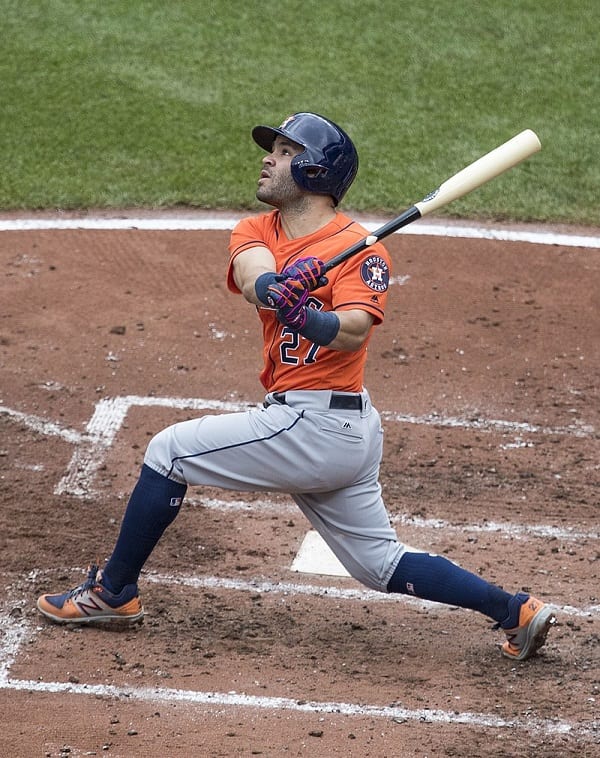
Altuve tightly crams the energy of an 8-foot-athlete into his stocky frame, allowing himself the tenacity and grit of the most determined sportsmen. The batting average for the 2019 MLB season is .252 (meaning out of every ten pitches, the player will hit 2 of them). Altuve’s is .298 (3 out of ten pitches) for the season and .315 for his career. For context, a 0.200 is considered unacceptable, and 0.333 is deemed to be excellent.
Baseball, an American beloved past time, isn’t about the numbers–it’s about the heart of the players, the love of the game, the hotdogs and the peanuts…. Right? Not exactly. Baseball has always had some form of statistics, evolving over the years with the game.
Baseball Science and Statistics’ Beginnings: The Box Score
Keeping records on players began in 1859. Henry Chadwick was a baseball writer, baseball amateur statistician, and baseball historian–there’s little wonder why he’s referred to as the “Father of Baseball” for his early contribution to the sport.
Sculpting the perception of the competition, Chadwick wrote the first public baseball guides, listing information on players, including number of home runs, strikeouts, and total games played.
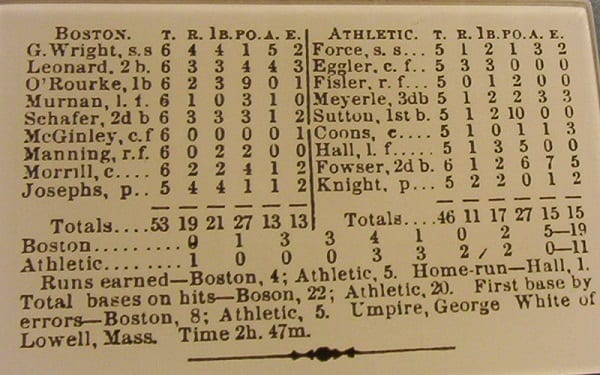
He adapted the cricket scorekeeping to make the box score, highlighting the scores of each inning for a given game. In addition to listing scores of the teams, individual player’s information is listed. The box score led to more standardized repetition, leading to phrases like “top of the inning,” “triple play,” and “sacrifice fly.”
Then Along Came a Metallurgist for Even More Complex Baseball Science
Traditionally, baseball statistics like batting average and earned run average, both developed by Chadwick, dominate attention. In 1964, Earnshaw Cook published his research in a book, Percentage Baseball. Cook worked to understand non-traditional baseball strategies, like batting order and relief pitching. His slide rule used for calculations for the statistics in the book is now in the Baseball Hall of Fame.
An engineer specializing in metallurgy, Cook received criticism from baseball executives and career statisticians. Though some of his predictions were wildly inaccurate, with Baseball Historian Statistician Bill James clarifying
Cook knew everything about statistics and nothing … about baseball.
His methods were useless, but his unorthodox approach to lead to unearthing important information, much of which was accepted as common knowledge in sabermetrics.
Named after the Society for American Baseball Research (SABR) organized in 1971, sabermetrics interprets in-game activity and performance via statistics. Baseball stats are analyzed, manipulated, and interpreted as data from IBM mainframe computers.
The Sabermetricians, sometimes considered baseball statisticians, focus on running average rather than batting average. The logic behind this thinking is that runs win baseball games, not hits, ergo, a good measure of a player’s worth is his runs as opposed to his batting.
But in the end, Baseball is all about the Money?
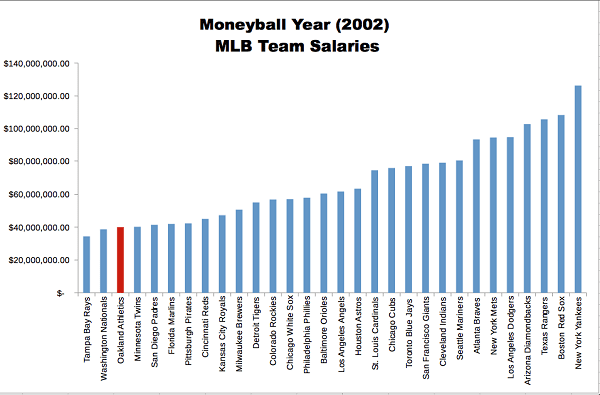
Nine years later, in the 1980s, Bill James began writing about the teams that could target underutilized player talent through statistical analysis. This idea became the foundation for the small-budget Oakland Athletics’ tactics: using baseball statistics in innovative ways to better assess players’ abilities.
The bold new approach of bringing analytical and new statistical evidence to competitive baseball was captured in Michael Lewis’ 2004 book, Moneyball.
Lewis explains that “baseball insiders,” such as coaches, managers, and players, often function on flawed and subjective traditions.
Historically, scouts evaluate players to add to the team, using relics of the 1800s like batting average and stolen bases. Sabermetrics argues that rigorous statistical analytics can better gauge performance of players, for example by focusing on on-base and slugging percentages.
The 2002 Athletics stayed competitive with large teams like the New York Yankees by finding undervalued college baseball players with strong stats. The new system worked.
The Athletics has 20 consecutive winning games. They went to playoffs in 2002 and 2003. The Athletics finished first in the American West League with a record of 103-59 (W-L).
How does Altuve fit into all of this?
In 2007, Altuve came into the minor league baseball stadium just as the Moneyball era begins. Three years before, Slate coined an article called Disastros: Houston’s baseball team is cursed, too, reminding the world that the Astros had never won a World Series, let alone won a playoff series.
[The Astros will] go home losers for the 43rd straight year,
Josh Levin wrote, elaborating that
the Houston Astros can’t have [a curse] because they haven’t had anything but loss.
Dis-Astro articles persisted all the way through 2015. Which was why it was so incredible that Ben Reiter wrote the 2014 Sports Illustrated cover story predicting the team would win the World Series in 2017. Which is true. The Houston Astros went from the “worst team in baseball” to the underdog World Series Champion of 2017.
Rieter wrote about what changed in his book Astroball. The Astros evolved the A’s “Moneyball” to create a sabermetrics system that complemented the traditional scouting tactics rather than trying to trump them. Astroball combines statistics, scouting data, player’s family history, and personality to select the best players.

What Did We Learn about Baseball Science, Statistics, Players, and Emotions?
This new system, analytics, and emotions, allows both the math and the heart of baseball to step into play. It will enable a man who was told he was too short for baseball at an Astros camp in 2006, during the infancy of Moneyball, to prove himself in the minor leagues for five years, achieve himself in the major leagues, and help lead his team to the World Series. Astroball allows for a man like Altuve to step up to bat.
Want more science now?
Check out our news page where we post interesting studies and discussions (sometimes mocking them mercilessly) for more.